Point-in-Time Count reports
Every year, we conduct a comprehensive enumeration that provides a snapshot of homelessness in Calgary, helping us understand trends over time and ensure our coordinated response creates lasting pathways out of homelessness for all Calgarians.

Data that informs our coordinated homeless response system
We use Point-in-Time Count data with our government, frontline agency and community partners to identify trends, allocate resources strategically, and ensure our unified response addresses the complex causes of homelessness while strengthening our entire system’s capacity to serve. Along with other data points, the PiT Count offers insight into the current state of homelessness, helps to identify trends over time, improve supports, and adjust strategies that better serve people at risk of experiencing homelessness.
About Point-in-Time Count reports
What is a Point-in-Time Count report?
The Point-in-Time Count report is a comprehensive enumeration conducted every year that provides a snapshot of homelessness in Calgary on a specific night. This biennial count helps us track how homelessness is changing over time and guides critical decisions about resource allocation and program development to better serve vulnerable Calgarians.
What type of data is collected?
We collect three types of data: administrative data from shelters, transitional housing facilities, and other accommodations; systems data from government offices showing people with no permanent home staying in hospitals, treatment facilities, or other institutions; and street data gathered through trained volunteer surveys of people living unsheltered in vehicles, tents, and makeshift shelters.
Why do a count?
The Point-in-Time Count is required as part of Calgary’s participation in the Government of Canada’s Reaching Home program, with the 2024 count overseen by Calgary Homeless Foundation (CHF). While agencies track people accessing their programs and services, they don’t capture data about people experiencing homelessness who aren’t sheltered. The count allows us to understand the full scope of homelessness in our city—including people sleeping rough, or staying in places like hospitals or correctional facilities when they have nowhere else to go.
Who conducts the count?
Calgary has conducted Point-in-Time Counts every two years since 1992. Since 2016, we’ve participated in a provincially coordinated count as part of Alberta’s “7 Cities” initiative, using consistent methodology to identify trends across the province. Our counts are required by the federal government through the Reaching Home program, contributing to a national understanding of homelessness across Canada.
What types of data do we collect?
Administrative data
This data comes from emergency shelters, transitional housing facilities, domestic violence shelters, and other temporary accommodations. Administrative data provides crucial insights into people accessing formal shelter services and helps us understand capacity utilization and the demographics of people using these essential services.
Systems data
Collected from Alberta Health Services, Alberta Justice and Solicitor General, and Alberta Community and Social Services, this data reveals people with no permanent home who are staying in hospitals, treatment facilities, correctional facilities, and hotels or motels sponsored by social services—capturing those who might otherwise be invisible in homelessness counts.
Street data
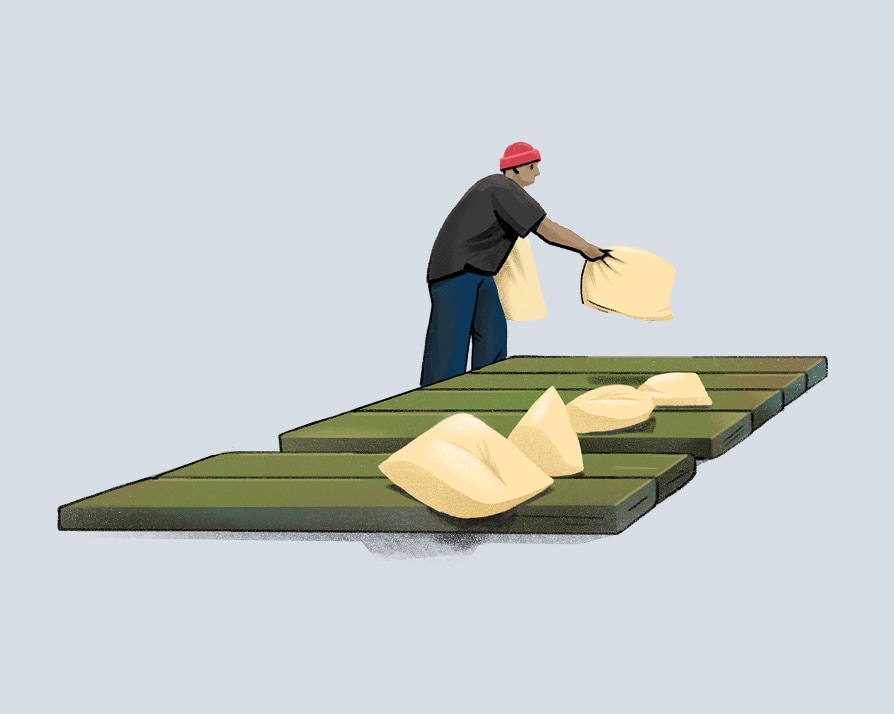
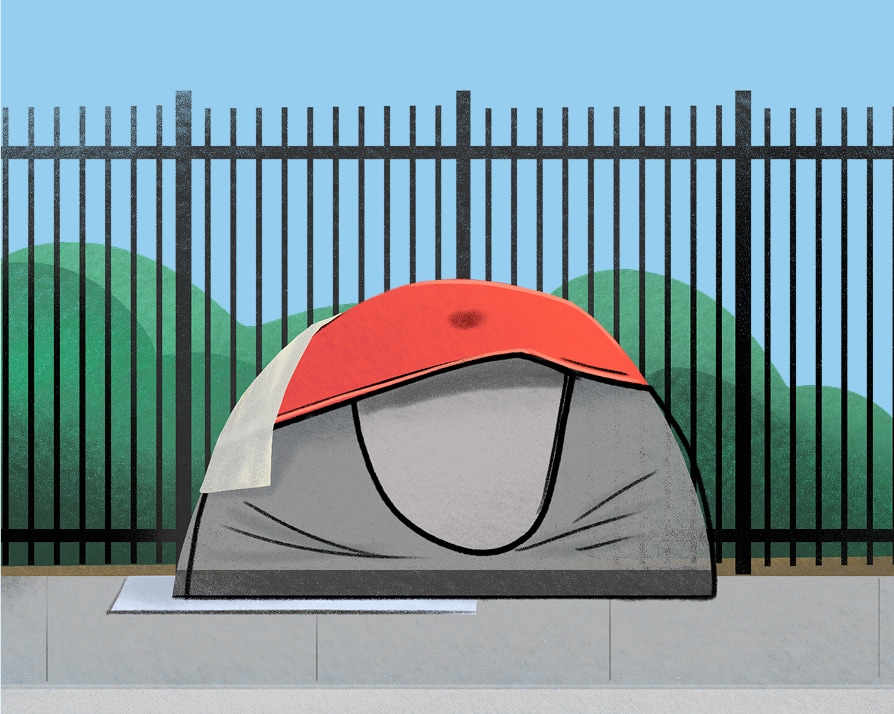
Gathered through in-person surveys conducted by trained volunteers, this data captures people sleeping in places like vehicles, tents, and makeshift shelters. These surveys help us understand the experiences and needs of people who are not accessing formal shelter services and provide critical insights into unsheltered homelessness.
Recent Point-in-Time
Count Reports
People experiencing homelessness in Calgary represent every demographic–all ethnicities, genders, and ages can experience homelessness. Our Point-in-Time Count captures this diversity and reveals important trends, helping ensure our coordinated response addresses the needs of all Calgarians while working toward a future where homelessness is rare, brief, and non-recurring.
Rate of homelessness over the years
(per 1000 Calgarians)
3,121
individuals and heads of households were identified as experiencing homelessness during the 2024 PIT count
Sheltered status
Gender identity
60%
Male
29%
Female
<1%
Trans or diverse
11% unknown
Ethnicity
All ages
Caucasian
1,239 people
Indigenous
771 people
African/Caribbean
341 people
Other racial ethnicity
215 people
18% unknown
Children & youth (0-17)
Caucasian
75 people
Indigenous
108 people
African/Caribbean
20 people
Other racial ethnicity
13 people
Immigration status
The proportion of individuals experiencing homelessness who hold some form of immigration status has risen to 16%, up from 10% in 2022.
Reasons for housing loss
Go deeper into the data
Disclaimer: The Point-in-Time Count provides a snapshot of homelessness on one specific night and helps identify trends over time. While it captures important data about people accessing shelters and living unsheltered, it may not reflect the full scope of hidden homelessness in our community.
People experiencing homelessness in Calgary represent every demographic–all ethnicities, genders, and ages can experience homelessness. Our Point-in-Time Count captures this diversity and reveals important trends, helping ensure our coordinated response addresses the needs of all Calgarians while working toward a future where homelessness is rare, brief, and non-recurring.
2,782
individuals and heads of households were identified as experiencing homelessness during the 2022 PIT count
Sheltered status
Gender identity
67%
Male
31%
Female
<1%
Trans or diverse
2% unknown
Ethnicity
Caucasian
Indigenous
Other
Unknown
Reasons for housing loss
People experiencing homelessness in Calgary represent every demographic–all ethnicities, genders, and ages can experience homelessness. Our Point-in-Time Count captures this diversity and reveals important trends, helping ensure our coordinated response addresses the needs of all Calgarians while working toward a future where homelessness is rare, brief, and non-recurring.
2,911
individuals and heads of households were identified as experiencing homelessness during the 2018 PIT count
Sheltered status
Gender identity
72%
Male
26%
Female
1%
Trans or diverse
Ethnicity
Caucasian
Indigenous
Other
Unknown
Reasons for housing loss
Historical Point-in-Time Count reports
Explore our archive of Point-in-Time Count reports to see how homelessness trends have evolved in Calgary and how our coordinated response continues to adapt to meet emerging needs while working toward lasting solutions.
2024
2022
2021
2018
Calgary
Alberta
2016
Calgary
Alberta
2014
Calgary
Alberta
2012
Extreme Weather Response
When Calgary’s temperatures drop to dangerous levels, or when extreme heat or wildfire smoke create hazards, our Extreme Weather Response (EWR) mobilizes the entire community to ensure no one faces the elements without support. Discover how this coordinated initiative provides spaces, supplies, and pathways to safety during our city’s harshest conditions.